The purpose of temperature mapping is to identify hot spots, to know how the internal temperature is affected by climatic changes and to better manage the storage of your product. The MHRA recommend temperature mapping is conducted once in the summer and once in the winter.
We suggest that initially, a temperature mapping survey is conducted either:
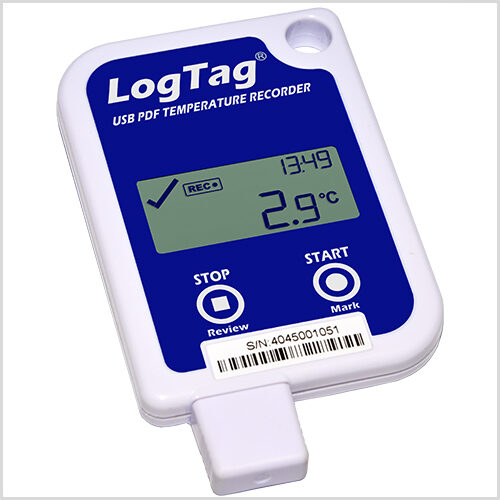
- By the pharmaceutical company, using temperature mapping packs such as the MapPack5 to MapPack100 by LogTag, available for purchase at Loggershop. They contain:
[bulllist]- 5 to 100 TRIX-8 LogTag temperature data loggers
- Calibration certificates for all data loggers
- Individual calibration labels
- 1 x LogTag Analyser data logger software
- 1 x USB drive including templates
- 1 x USB interface
[/bulllist]
- By specialised engineers such as Wessex Power, our sister company who offer complete temperature monitoring solutions.
The authorities require that readings of minimum and maximum temperature are recorded at least hourly. This can be carried out manually, which is very time consuming and in-accurate or alternatively by data loggers which can be placed anywhere and automatically create a full log of temperatures. This data can be downloaded automatically to calculate min/max values, averages, means, MKT, as well as standard deviation. If needed, a product life versus temperature calculation could be performed in the software.
This mapping exercise ensures compliance as well as enabling proper use of the warehouse and a fuller understanding of products affected by temperatures.
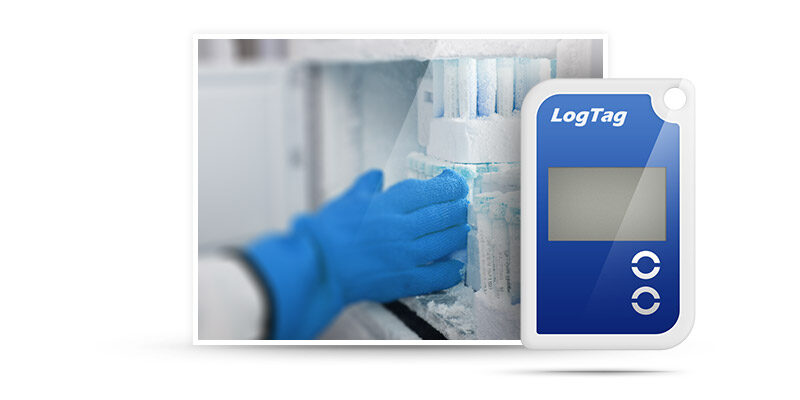
If you have warehouses, cold stores, fridges, freezers, stability cabinets etc, where temperature sensitive pharmaceutical products are stored, you will need to temperature map these areas.
What does a temperature mapping survey tell me?
A temperature mapping survey can reveal a great deal of information about the dynamics and performance of your installation. This is just the information you need to confirm proper operation of the system or to identify and resolve suspected shortcomings in the performance.
A survey will plainly reveal: stratification of the air, hot and cold-spots, anomalies in the chilling/heating system, power outages, the effects of door-openings, effects of introducing goods, presence of personnel, time-to recovery of set temperature, and much more.
The report contains all the data shown as multi-trace coloured graphs for the entire area plus sectional breakdowns to point up differences by location, level etc. Where unexpected behaviour is seen, a sectional graph will be produced to give a zoomed-in view allowing closer scrutiny of the data.
Examination of the multi trace graphs will reveal the movement of change in temperatures in the volume so indicating air-movements, Derived values of max, min and average are shown for each location in bar-graphs to help point up any zoning either by level or plan-location. This will show you if you have a patchy, uneven distribution of temperatures.
Purchase our temperature mapping packs online or for more guidance on temperature mapping please call 01929 459459 or email us.